
Veja também


 12.11.2026 08:17 PM
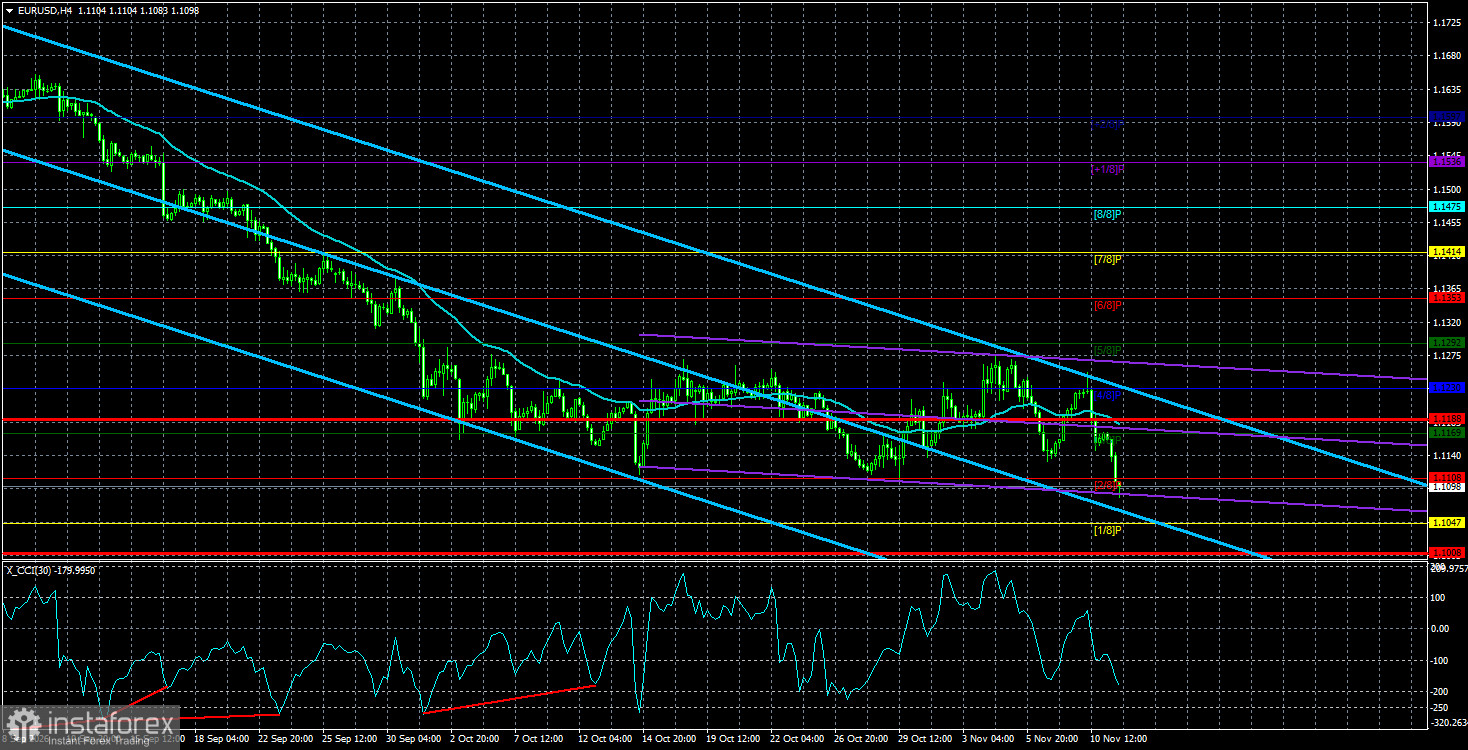
The EUR/USD pair traded lower again on Wednesday, but Tuesday's moves were far more interesting. On Tuesday, the US inflation report for October — which "made a stir" — was published. Annual CPI figures were not released this time because the US had another government shutdown in October last year. Traders therefore had to make do with monthly numbers. Even those, however, were enough for the dollar to rise about 100 pips once more. The euro is being kept afloat only by the sideways channel the pair has traded in for a month — but this lucky interlude won't last forever. If the market simply refuses to buy the euro under any circumstances, nothing will help it.
Back to the US inflation report. Month-on-month, the consumer-price index printed +0.4%, 0.1 percentage point above forecasts. That extra 0.1% sent the US dollar up roughly 100 pips and pushed market hawkishness on Federal Reserve policy higher again. Fed officials' comments added fuel to the fire: for example, Christopher Waller said he might support a 50-bp hike in December, and Lorie Logan said at least two further 25-bp tightenings are the base case given current inflation.
So the dollar's strength, in principle, is understandable — except for one "but." Does anyone still remember that the dollar is not a currency that lives in isolation? Right now we analyze it against the euro; thus, the macro and fundamental background in the euro area also matters and should at least be taken into account. The European Central Bank, meanwhile, will carry out its third rate hike in December. In other words, the ECB's cumulative tightening will be even greater than the Fed's. Yet the dollar is rising on Fed tightening while the euro ignores ECB tightening. Under such circumstances, the US currency could theoretically keep rising all the way to parity.
What is most surprising is that the market ignores not only news from the euro area — which could be explained away somehow — but even geopolitics. Over the past week, geopolitical tension has eased somewhat, and in 2026 geopolitics was a key factor supporting the dollar. What happens: when the Middle East was heating up, the dollar rose; now that there are tentative hopes for peace, the dollar... still rises.
Even more striking is that most experts and analysts also ignore the factors in the euro's favor. It's much easier for them to close their eyes to inconvenient facts because they can't explain the current EUR/USD move. If it can't be explained, they simply don't pay attention. Let the ECB do what it wants and the dollar rise — "because the Fed is hiking."
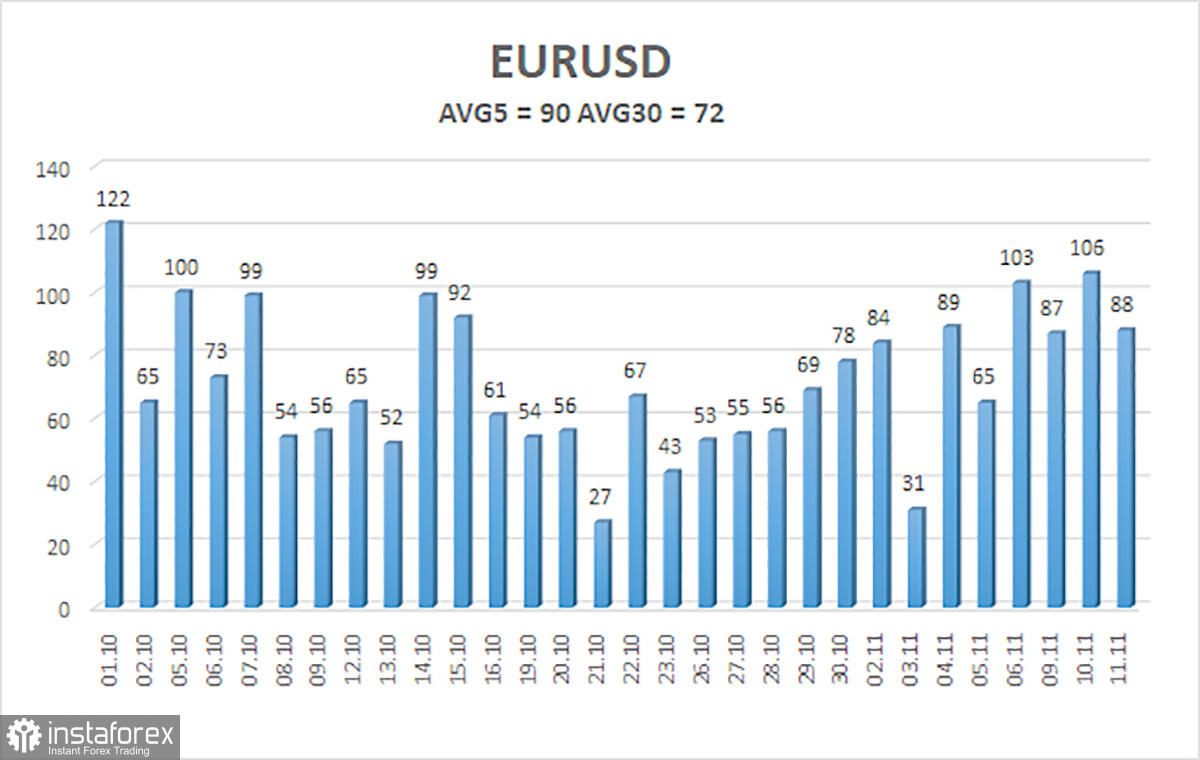
The average volatility of the EUR/USD pair over the last 5 trading days as of November 12 is 90 pips and is characterized as "average." We expect the pair to move between 1.1008 and 1.1188 on Thursday. The major linear-regression channel points down, indicating a downtrend. The CCI indicator entered the oversold area five times and formed four "bullish" divergences, but traders ignored all these signals. The illogical downtrend persists.
S1 – 1.1047
S2 – 1.0986
S3 – 1.0925
R1 – 1.1108
R2 – 1.1169
R3 – 1.1230
The EUR/USD pair remains in a downtrend with insufficient fundamental, macroeconomic, or geopolitical support for continuation. The global fundamental backdrop for the dollar remains negative, but in 2026, geopolitics and then the Fed's hawkish stance provided strong support for the US currency. When the price is below the moving average, short positions can be considered with targets of 1.1047 and 1.1008. Above the moving average, long positions are relevant with targets of 1.1230 and 1.1292. However, the pair first needs to break out of the sideways channel 1.1114–1.1265.


