
Lihat juga


 11.11.2026 07:27 AM
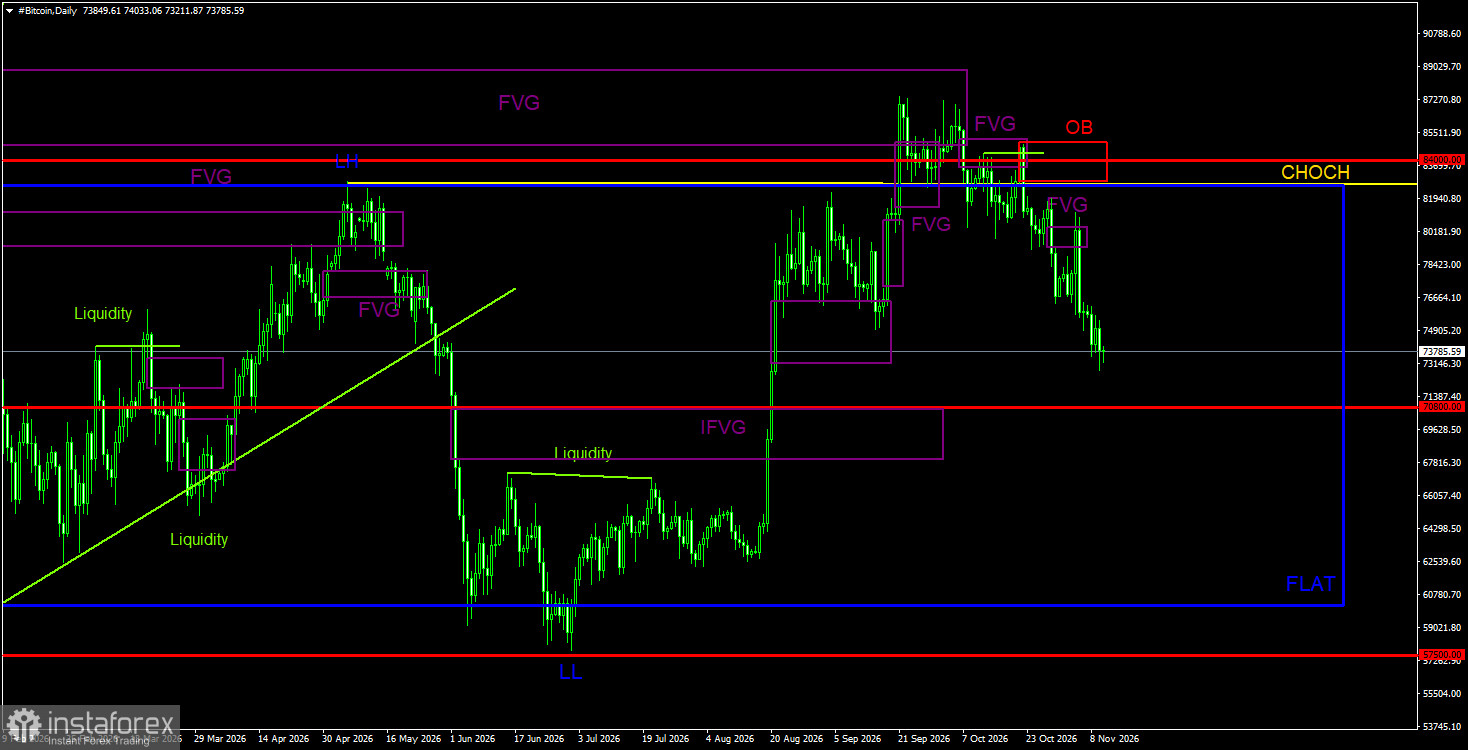
Bitcoin keeps falling and hopes for a bullish trend are melting like mid-April snow. The market experienced another crash last week, and the decline continues this week. The move is still considered corrective for now, yet Bitcoin is slipping lower more confidently despite regular pullbacks. Recall there is some chance the downtrend has finished, but the reasons for a new bull phase remain ambiguous and contested. The recent three-month rise was essentially a move from the lower boundary of the daily range to the upper boundary after a deviation of the lower boundary and formation of a deviation of the upper boundary. The upper boundary deviation was deep, but if it indeed was a deviation, Bitcoin set a course for $70,800. Digital gold has returned to the range, so a move to its 50% level would be more than reasonable. In principle, Bitcoin has only $2–3k to reach $70,800. What is $2–3k for digital gold?
Yesterday's U.S. inflation report made Bitcoin's prospects even worse. Although a Fed decision on the policy rate in December is effectively priced in, the stronger inflation rises, the higher the probability the regulator will continue tightening next year. Remember: for all risk assets, including crypto, looser central bank policy is better. We have said for months there are no fundamental grounds for a full bull trend in Bitcoin. Technical analysis still points to a preserved global flat. The upper boundary deviation of the sideways channel indicates movement toward the lower boundary. Thus, a drop in Bitcoin to $57,500 would be a reasonable development in the coming months.
BTC/USD daily picture (1D)
On the daily timeframe the downtrend structure was broken, so Bitcoin may have formally started forming a new bull trend. However, price consumed a bearish FVG from the previous trend, reacted to that pattern, and a correction began. The breakout beyond the September sideways channel ($60,000–$82,500) may have been a deviation, which, combined with reactions to two bearish FVGs, can trigger a decline to the lower boundary of the range. This week Bitcoin also corrected to the nearest bearish FVG and delivered a clear reaction that produced a new sell signal. Thus, we still do not consider the bearish trend or the flat to be over.
Other articles to read:
EUR/USD review. November 11. USD keeps surprising with its strength
GBP/USD review. November 11. How US inflation affects market?
Should you take Donald Trump at his word?
How to trade EUR/USD on November 11? Simple tips and trade breakdowns for beginners
How to trade GBP/USD on November 11? Simple tips and trade breakdowns for beginners
What to watch on November 11? Fundamental events explained for beginners
Interpretation of EUR/USD analysis results on November 11
Interpretation of GBP/USD analysis results on November 11
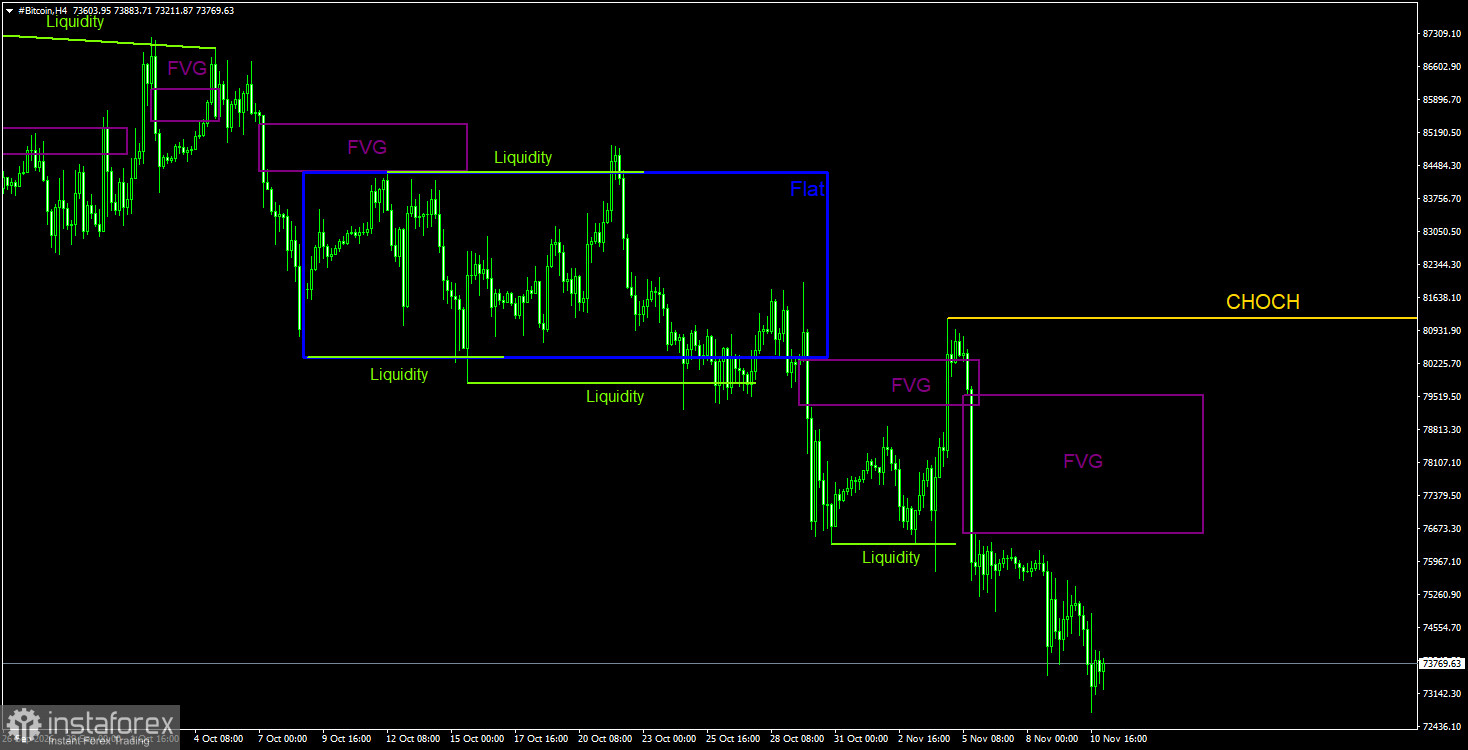
BTC/USD picture, H4
On the 4-hour timeframe,a bearish structure continues to form. The CHOCH line currently sits near $81,200. All necessary daily-timeframe sell signals have been produced, allowing traders to open shorts. Bitcoin's targets are best defined by the daily range, which we view as still relevant. The 4H trend structure is bearish, and on the daily, Bitcoin reacted to yet another bearish pattern. A new drop arrived quickly... After that, another bearish FVG formed, to which the price has not fully corrected. A reaction to it may provoke further decline.
Trading recommendations for BTC/USD
Bitcoin attempted to start a new uptrend, but the fundamental backdrop, spot demand, and recent news are too negative to rely on continuation. On the daily timeframe, Bitcoin may remain in decline, since price has already reacted to three bearish FVGs and formed a bearish order block. A move outside the daily sideways channel is treated as a deviation. Thus, Bitcoin produced a reversal signal and set a course for $70,800. We do not believe the bearish trend is over. Short positions are more relevant near term than longs. Note the active bearish FVG on the daily chart, around which a sell signal formed. On the 4-hour timeframe, a new bearish FVG has formed; a reaction to it will give traders opportunities to open new short positions.
Illustration notes
CHOCH — change of trend structure.
Liquidity — liquidity, stop losses, and pending orders market makers use to accumulate positions.
FVG — fair value gap. A price inefficiency area that price traverses quickly, indicating the absence of one side of the market; price tends to return and react to such areas in continuation of the main trend.
IFVG—inverted fair value gap. After a return to such an area, price often does not react but impulsively breaks through and then tests from the other side.
OB — order block. The candle where a market maker opened a position aiming to take liquidity to form a position in the opposite direction.


